|
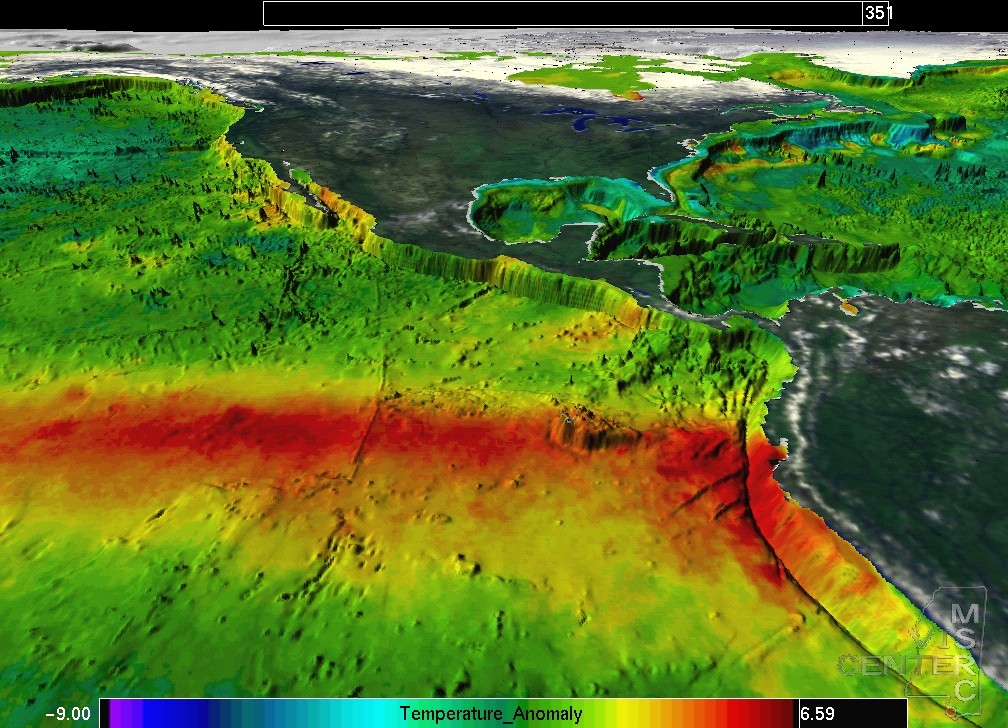
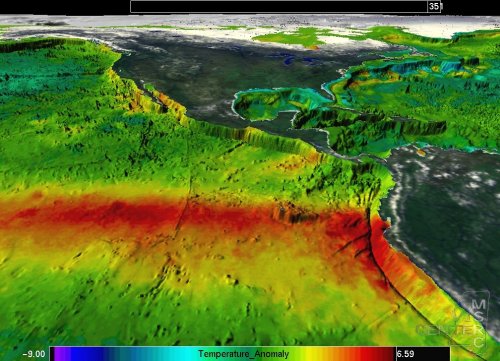
~The ClimateScope exploration software is broad user based assimilating multiple heterogeneous environmental data into a unified temporal and geospatial setting. The engine of ClimateScope builds around a unique user-interface enabling the user to navigate, select, and interact with global remote sensed data. The interaction is done within the visualization itself
a virtual reality
as if, reaching through a window, controlling the scene. The "scene interface" approach removes distractions and complexity involved with conventional user-interface layers such as, pop-up/pull-down menus, text boxes, forms, widgets, etc. The application requires very little keyboard use. Display and analysis of data is controlled by user selections with the mouse. The user-interface concepts in ClimateScope may be applied in many other visualization/exploration geo-spatial markets like oil and gas, meteorology, geo-political news media services, and science education.
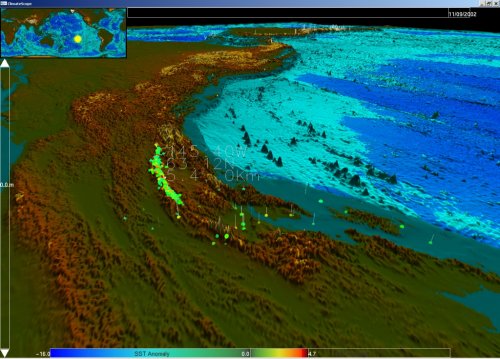
~The user-interface is fitted to a robust software chassis that has been field tested in many large-scale data visual analysis applications. Ocean modeling data has been the most widely used. Data sizes of global 1/16 to 1/32 degree scales over multiple depths with different data components (velocity vectors and scalars) have been handled at interactive speeds under the engines similar to ClimateScope. Several applications specifically designed for a user's model data are being used for visualization. They include: Parallel Ocean Program (POP), Polar Ice Prediction System (PIPS), Navy Layered Ocean Model (NLOM), and the Miami Isopycnal Coordinate Ocean Model (MICOM).
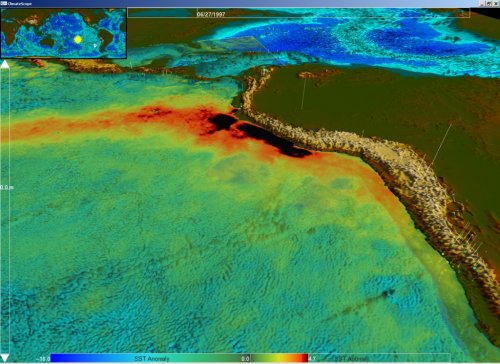
~ClimateScope exploration technology is based on common factors such as: 1.) Bathymetric & Topographic rendering engine; 2.) User-friendly interface; 3.) Analysis techniques (such as advection for tracking ocean currents over time-varying velocity data); 4.) Grid reconstructions and; 5.) Efficient data input and statistical output. These factors are modified and combined to build an application to fit a customer's specific data topology needs. The turn-around time for developing a ClimateScope style application fitted to a customer is 3-6 months, similar to applications written for previous ocean models. The current user base with universities and government research institutions support Defense Department High-Performance Computing "Challenge" projects. These customers can testify to accurate timely deliverables and follow through service on complete visualization applications. Univ. of Miami professor Dr. Eric Chassignet thanks Andy Haas for making the MICOMexplorer a reality. Compelling applications delivering user-friendly on-the-fly visualization, data mining large diverse bodies of information add value for any similar data intensive activities.
|